Definition of static and dynamic areas of interest in any environment, with any shape and size
Standard-conformant, automatic calculation of the duration for which the gaze was directed at the defined areas of interest
Timeline and list-based visualization of the durations for which the gaze was directed towards the areas of interest
Survey of eye tracking characteristics, statistics: e.g. accumulated gaze duration, average gaze duration, number of times the eye focused on a particular area, gaze frequency, maximum gaze duration, search activity
Accumulation of the results taken from all the test persons taking part in an experiment with descriptive statistics
Diverse visualization options:
Dynamic single heat map – visualization of how a test person's attention was distributed
Dynamic multiple heat map - visualization of group gaze behavior
Gaze progression diagram covering all areas of interest and test persons
Analysis of gaze behavior
Live Eye-Tracking
-Observe gaze behavior live -
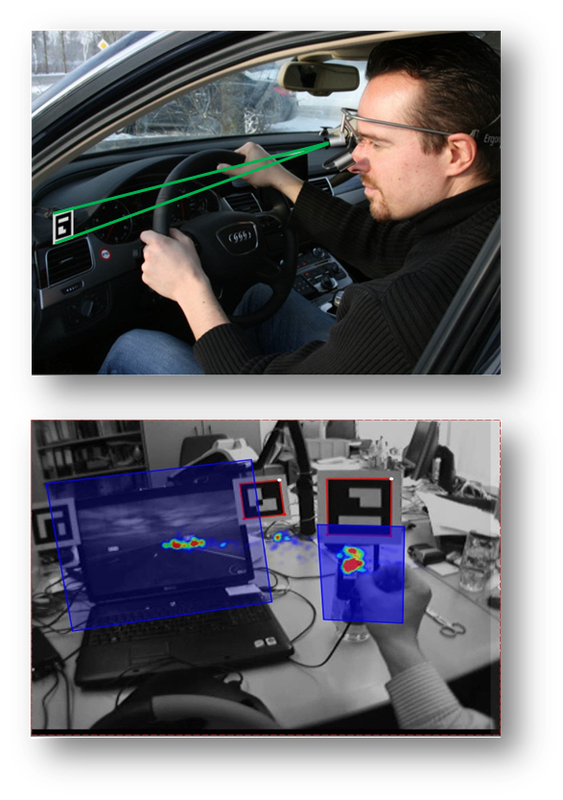
Include subjects behavior in retrospective think-aloud
Automated gaze data analysis due to marker-based head-position measurement
-Automated Area of Interest based analysis -3D visualizations (e.g. Single HeatMap, Multi HeatMap)
100% data availability due to re-calibration and offline eye-detection